Trade Idea - GAP
Friday, May 25, 2007
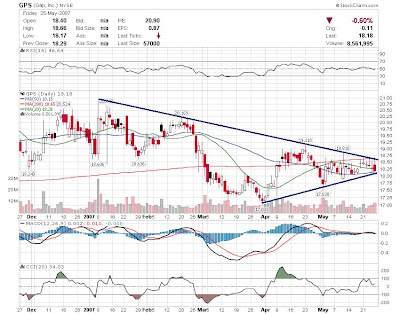
Shares of GAP down a bit today or 0.11$ to 18.18$ after reported lower earnings that were a penny a share better than forecasts. Stock trade more than 8 million shares, opening higher in the morning and closing lower. In the daily chart the current technical trend shows that the stock still trading in a downtrend mentioned by the blue line on top. Bearish MACD just crossover and RSI in now in Bearish territory too. Support at 18$ and resistance at 18.60$.
Disclaimer : Trading stocks involves risk, this information should not be viewed as trading recommendations.The charts provided here are not meant for investment purposes and only serve as technical examples.
Labels: GAP


