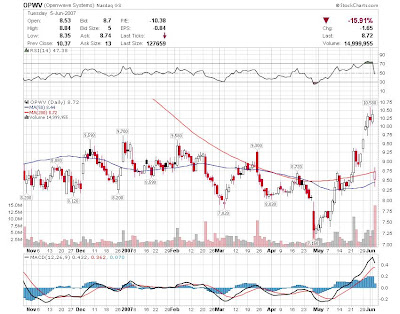
Openwave red today !!!
Tuesday, June 05, 2007
Looking at the daily chart of OPWV the technical picture is now very different from yesterday, stock turned to negative sentiment with indicators dropping to Bearishs areas. Stock on today session has been supported by the 50 dma line, so pay attention to this support, below 50 dma it's bad for stock. Support at 8.45$ and Resistance now at 8.72$.
Disclaimer : Trading stocks involves risk, this information should not be viewed as trading recommendations.The charts provided here are not meant for investment purposes and only serve as technical examples.


